Visualize your wellbeing data with Power BI
Company id and access token
See Getting Started on how to retrieve your company id and access token.
Request data from the API
In Power BI choose Get Data then go to Web. Type in the following URL, where you’ve replaced {companyId} with your company id:
https://api-ne1.worklifebarometer.com/v1.0/Dashboard/Company/{companyId}/answers
Don’t click OK yet. Instead click Advanced and fill in an HTTP request parameter as follows: In the header key choose Authorization In the header value type Bearer (including the space), followed by your access token.
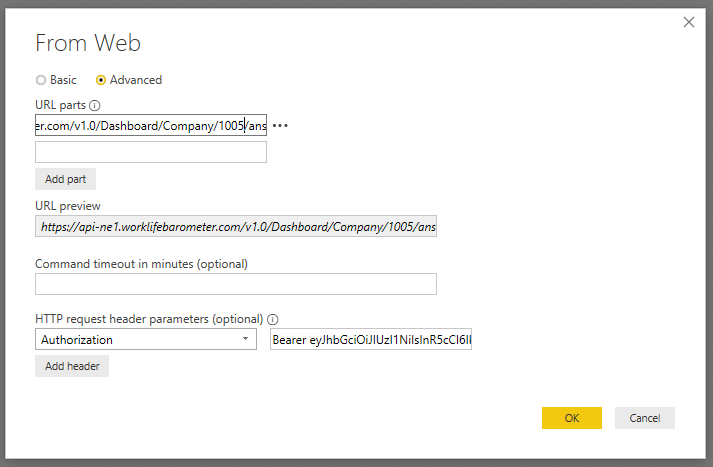
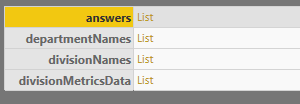
Now click OK and on the next page simply click Connect. After a little while you should now see something like this:
Format the JSON data for use by Power BI
We need to extract the right parts of the data for use by Power BI:
- Right click in the answers List cell and click Drill Down

- You should see a list of records. Right click the header row and then To Table. Click OK in the dialog.
-
Now you get a new table with again just
Recordlisted as content. - In the top right of this table there should be a splitter icon. Click it.
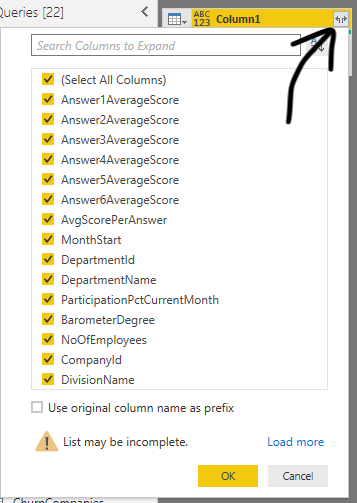
- In the dialog unselect
Use original column name as prefixand then clik OK. - Now you should see some actual data. We still need to provide some data type information.
- Right click MonthStart and choose Change Type >
Date/Time/Timezone - Right click AvgScorePerAnswer and choose Change Type >
Decimal number - Do the same for any other column you need, choosing either decimal or whole number
- Click Close and Apply in the top left
Visualize the data
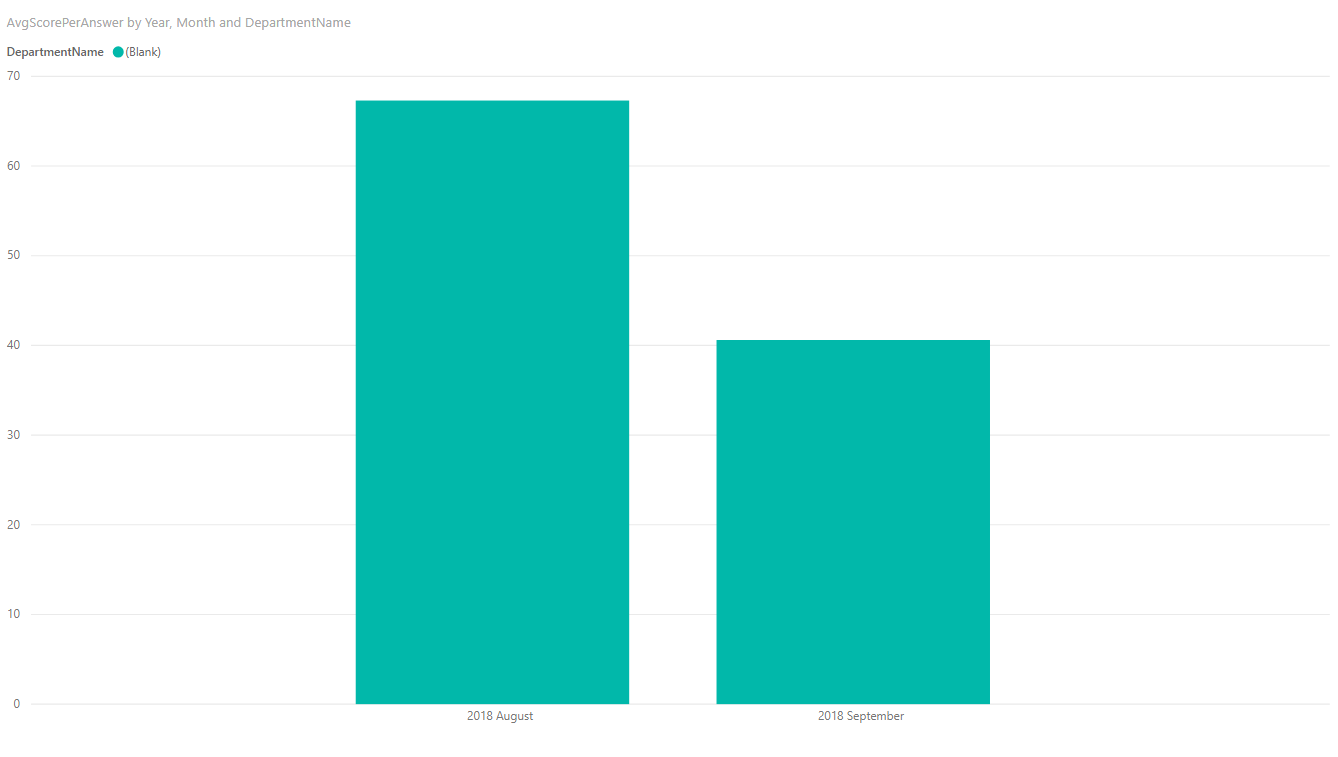
- Create a new stacked column visualization and choose from the answers table the MonthStart, AvgScorePerAnswer and DepartmentName columns
- Remove the date and quarter components from the date, since the data is provided on a monthly basis
- Drill down in the graph to see the visualization by month (the third little button in the upper left part of the chart)
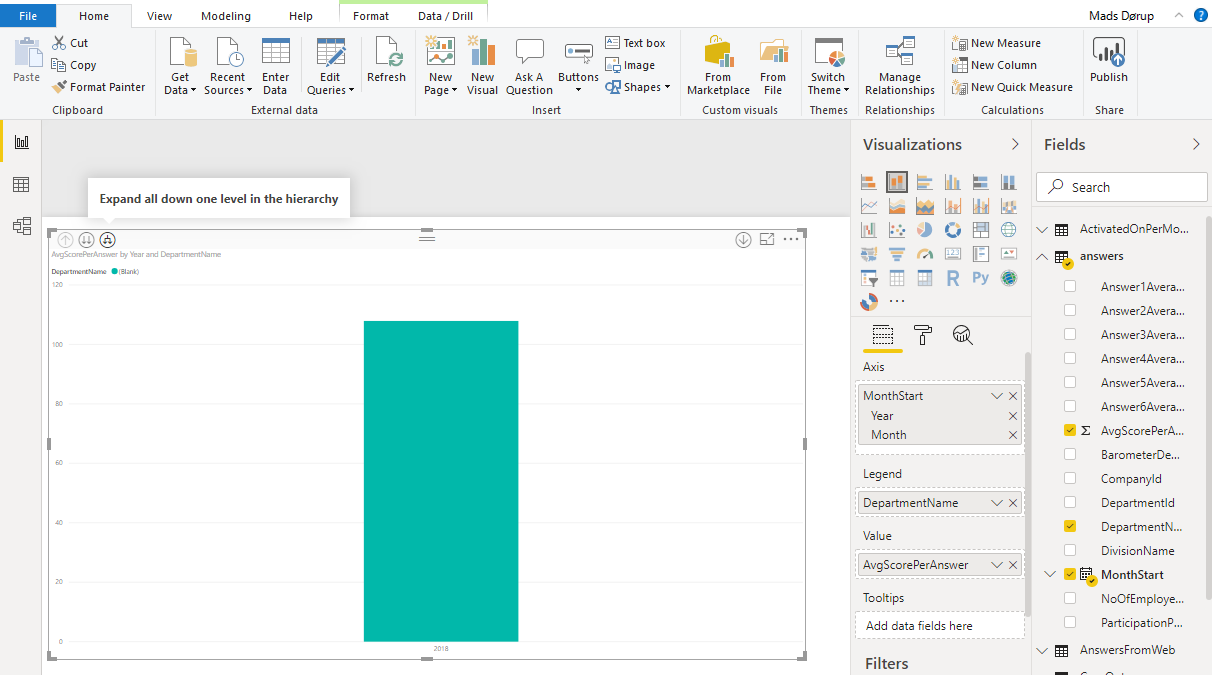
- Now you should see something like this, depending on your departmental structure and wellbeing data of course:
Case data
You can also read case data from the API. The structure of the data is a bit more complicated and you’ll have to figure out how to adapt it to Power BI yourself, but if you have it working for answers it shouldn’t be much different from that. The endpoint for that is:
GET https://api-ne1.worklifebarometer.com/v1.0/Dashboard/Company/{companyId}